Shopzada Pipeline Project
A full ETL pipeline using Kimball's architecture. Part of our Data Warehousing class.
- Course
- Data Warehousing
- Year
- 2025
- Role
- Group Project
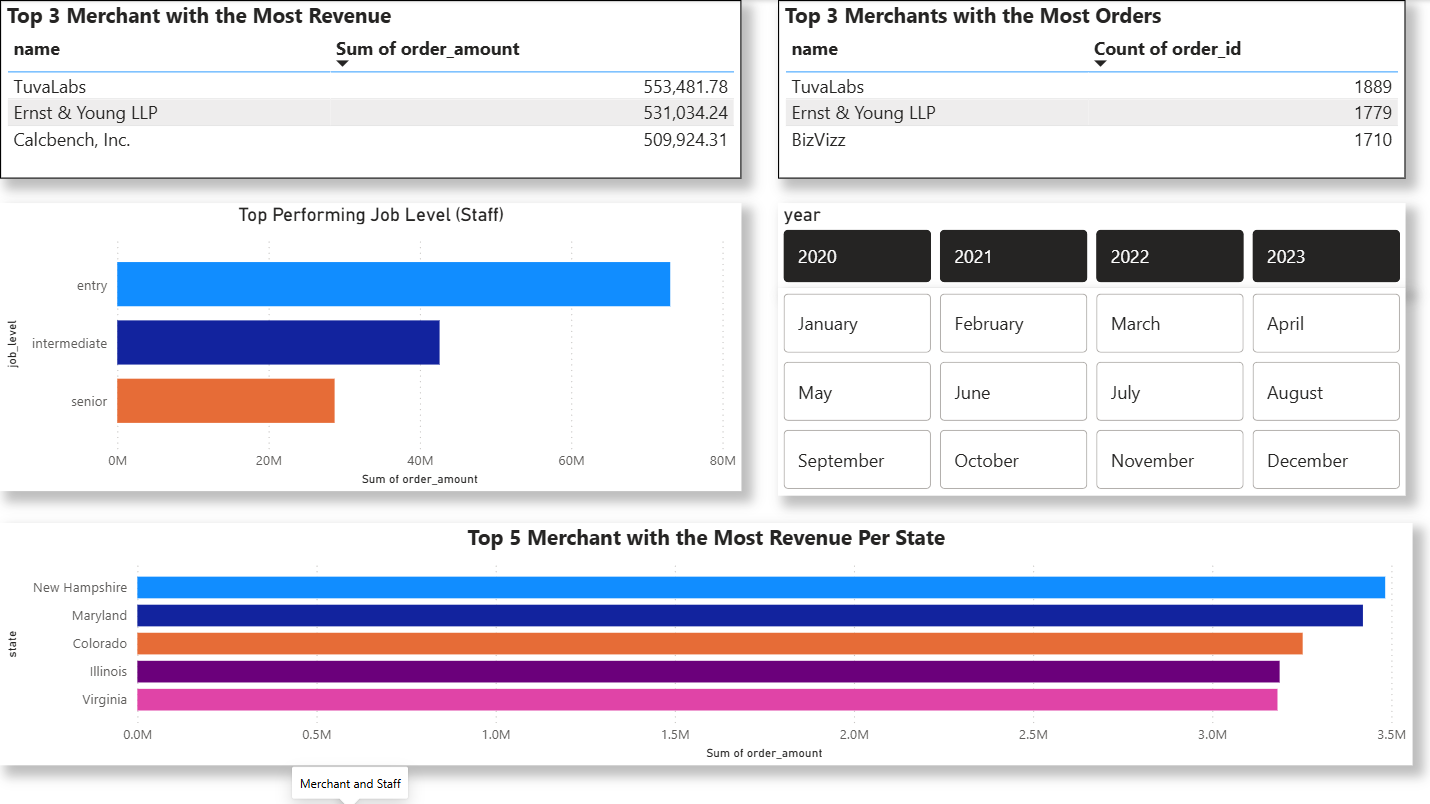
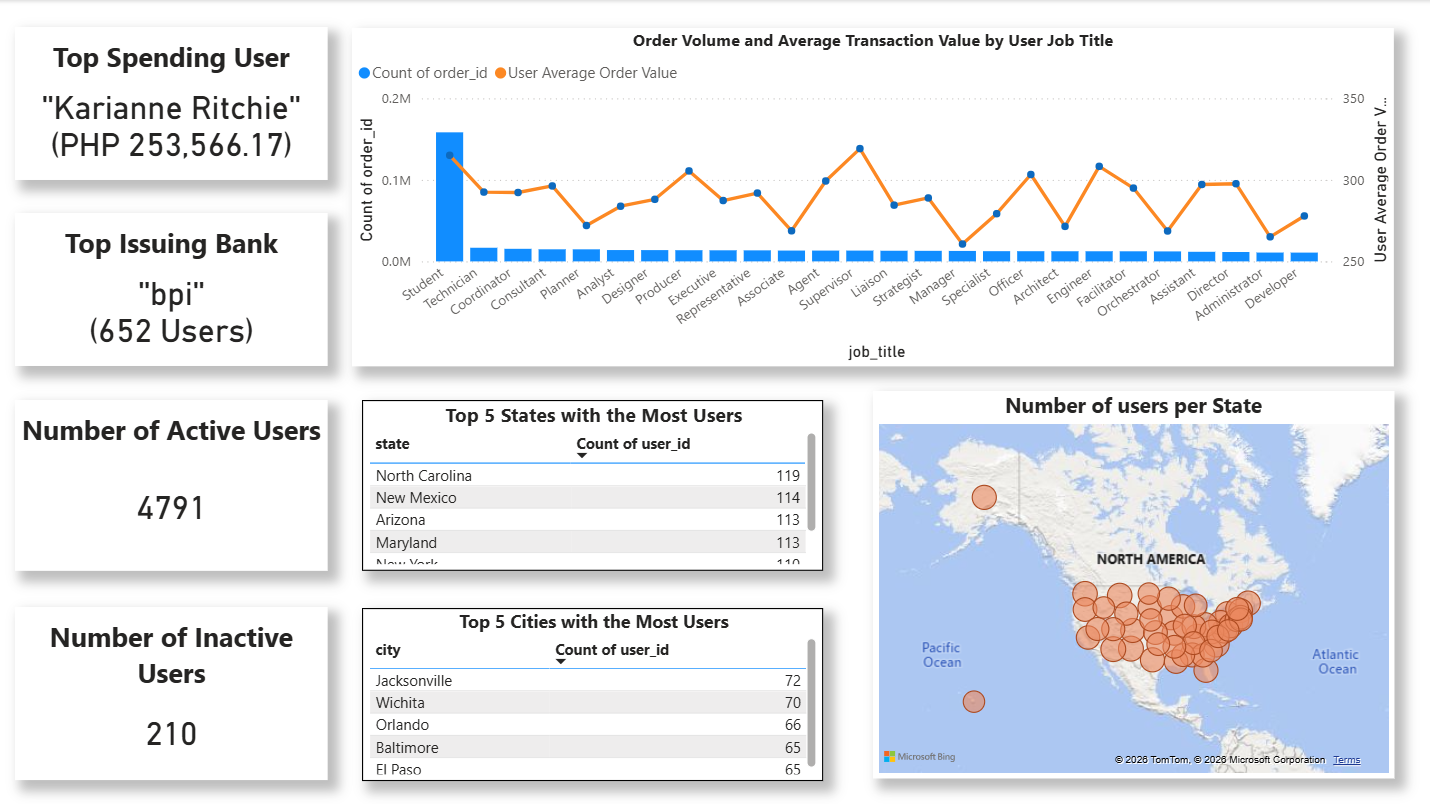
Overview
The ShopZada Pipeline Project was our final project for the Data Warehousing course, where we were given a very messy set of interrelated datasets and had to generate insights from them. The data mainly revolves around transactions, which connect customers, products, suppliers, and employees.
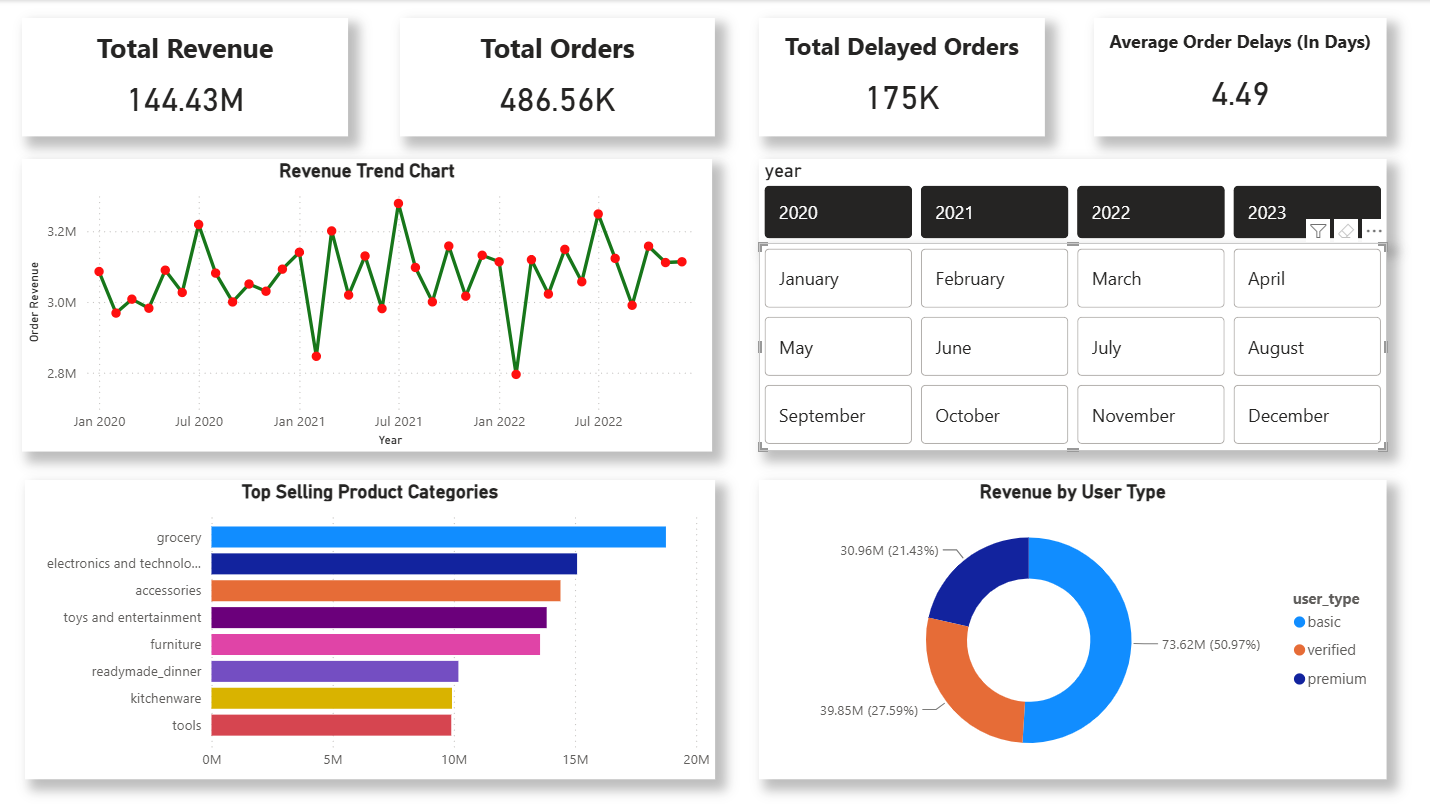
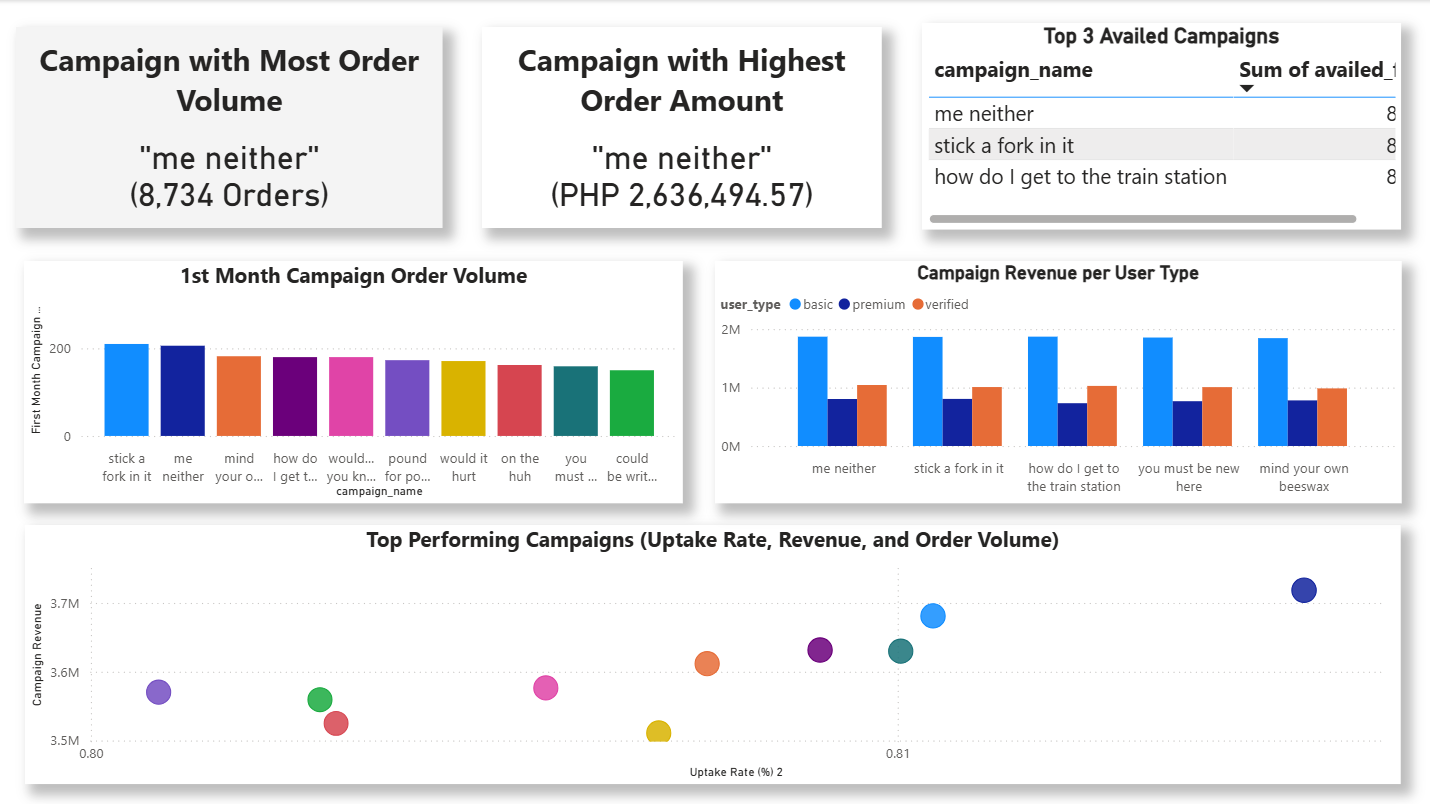
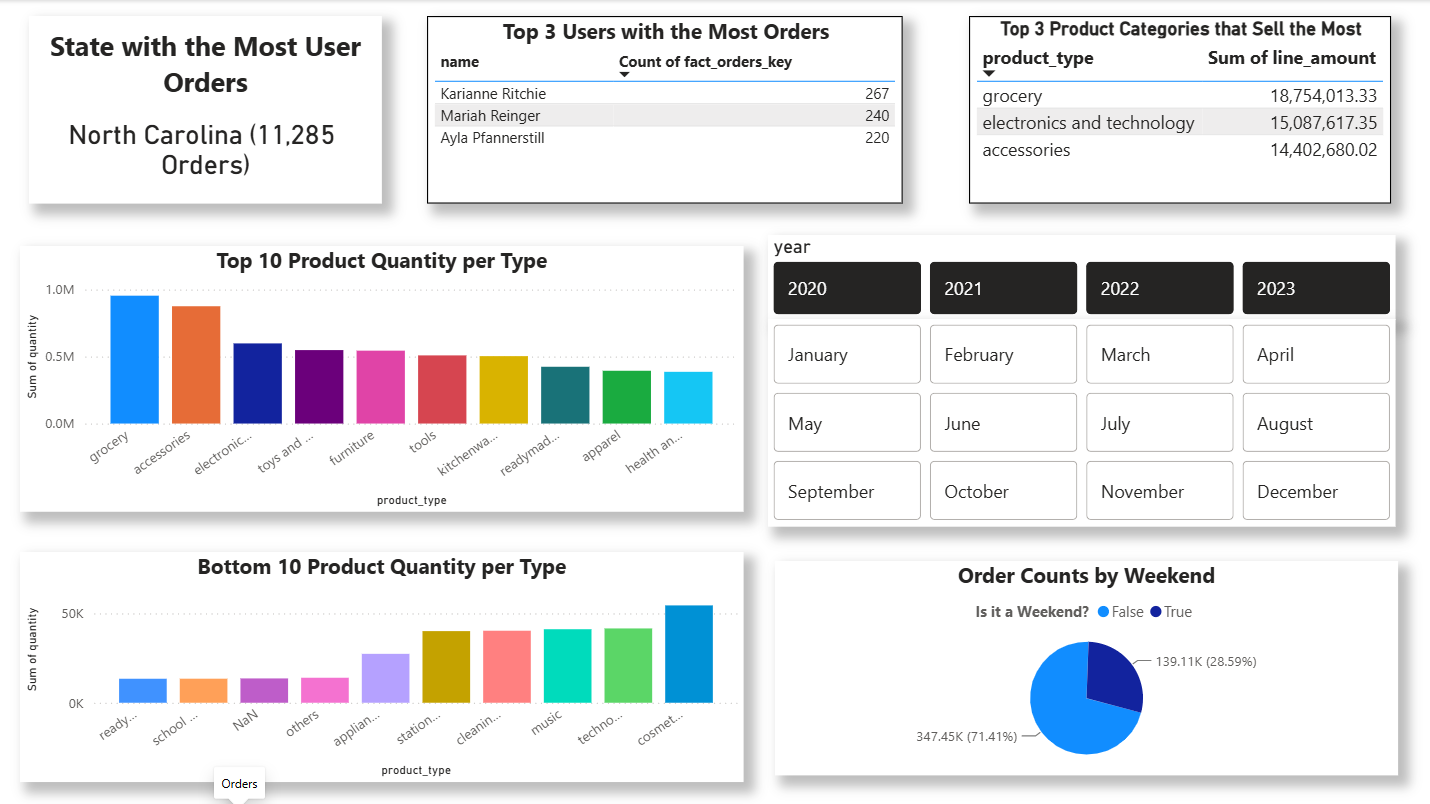
We decided to use Kimball's architecture, which uses dimension and fact tables to draw insights from the data. The cleaned data was presented in PowerBI using various types of graphs.
What I built
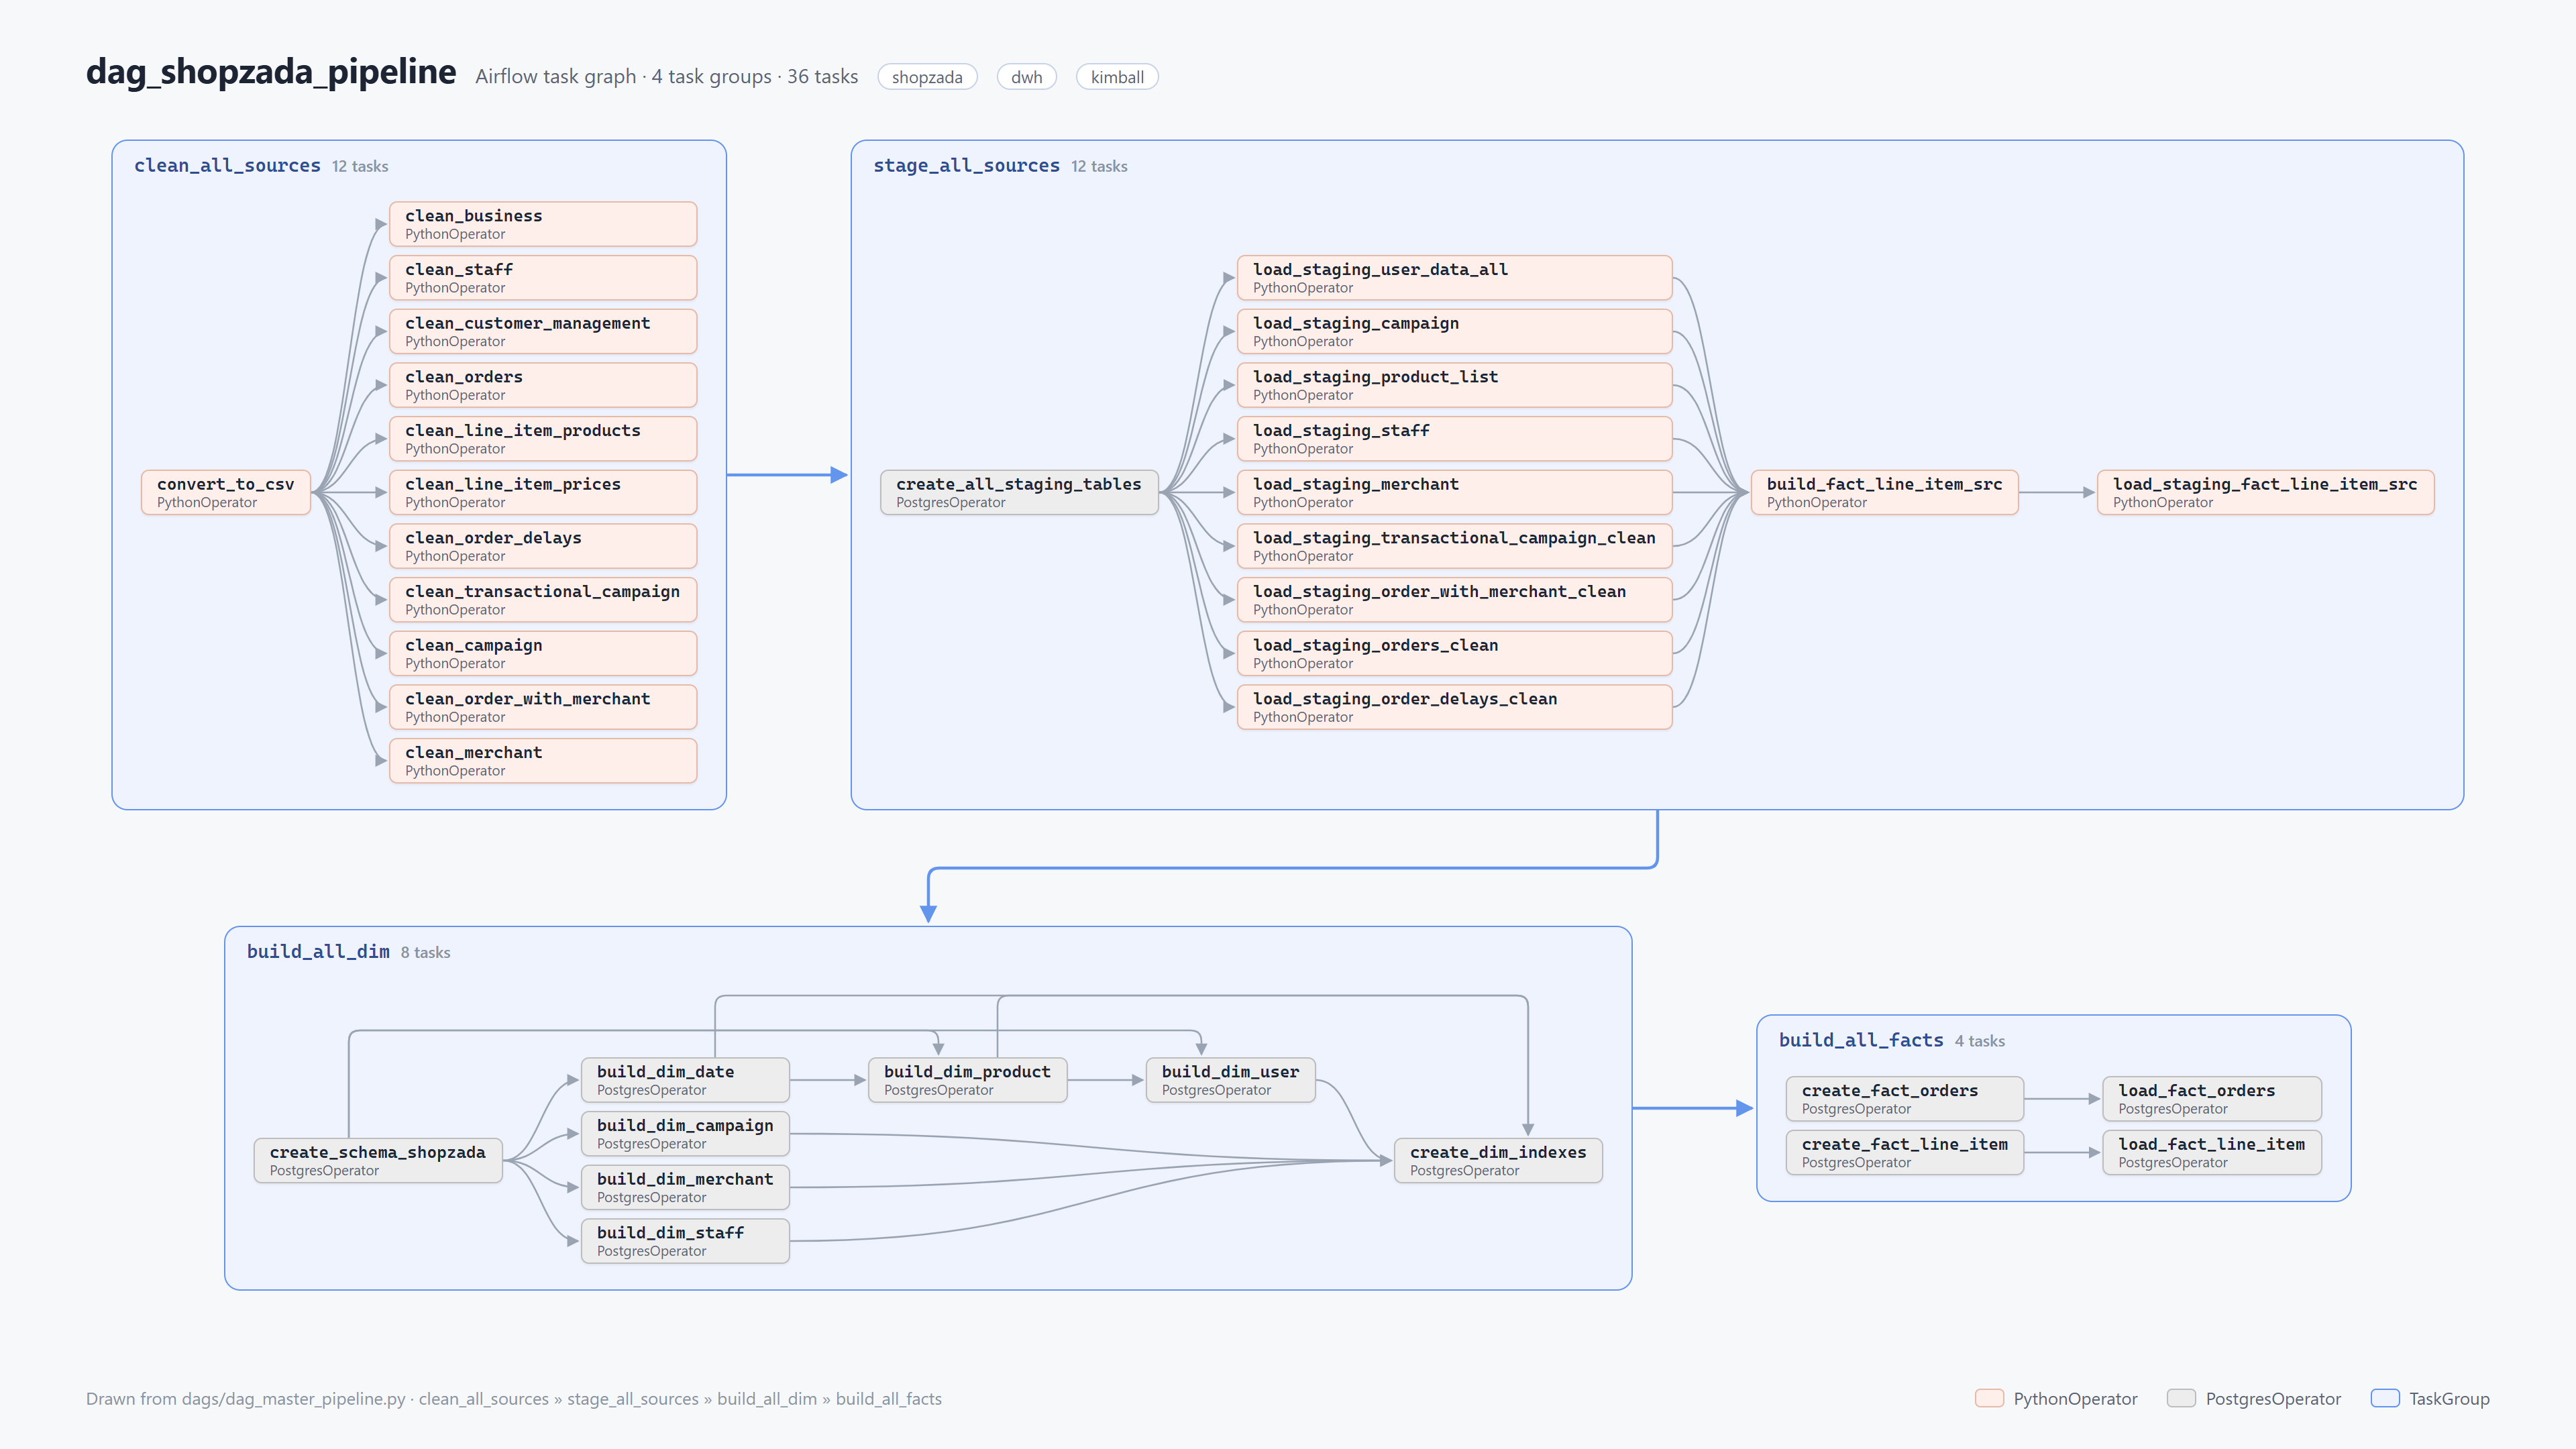
I was in charge of creating the ETL pipeline (from data staging to data presentation), so my work revolved around getting Apache Airflow, Docker, and PostgreSQL to work together. I also did the initial preparation for the PowerBI dashboard and some parts of the documentation.
Aside from my main role, I was also heavily involved in the Exploratory Data Analysis (EDA) so that I could understand the data before building the pipeline. EDA was the most time-consuming part of the project because we had to understand the data, plan out how to organize the dimension/fact tables, and make sound decisions on handling missing or improper values.